snow

Sunday, April 16, 2023

Time Series Analysis


MBA

Quantitative Analysis for Managerial Applications

ASSIGNMENT


Course Code: MMPC-005

Assignment Code: MMPC-005/TMA/JULY/2022 

Coverage : All Blocks


5. Write short notes on any two of the following:- 

(d) Time Series Analysis

Time series analysis is a statistical method used to analyse and model data collected over time. It involves examining historical data and identifying patterns or trends that can help predict future behaviour. Time series analysis can be used in a variety of fields, including finance, economics, engineering, and environmental science.

The primary objective of time series analysis is to develop a statistical model that captures the underlying patterns and trends in the data. This model can then be used to forecast future values of the time series. There are several techniques used in time series analysis, including trend analysis, seasonal analysis, cyclical analysis, and random fluctuation analysis.


(For the complete answer and also the full set of answers of MBA assignments/study notes WhatsApp me : +91 99 471 471 85 or purchase it from here)


Exponential Distribution


MBA

Quantitative Analysis for Managerial Applications

ASSIGNMENT


Course Code: MMPC-005

Assignment Code: MMPC-005/TMA/JULY/2022 

Coverage : All Blocks


5. Write short notes on any two of the following:- 

(c) Exponential Distribution

Exponential distribution is a continuous probability distribution that models the time between events occurring in a Poisson process, where events occur randomly and independently over time. 

The exponential distribution is characterized by a single parameter, the rate parameter, which determines the shape and scale of the distribution. 

The probability density function (PDF) of the exponential distribution is given by: f(x;λ) = λ * e^(-λx) where x is the time between events, λ is the rate parameter, and e is the base of the natural logarithm.


(For the complete answer and also the full set of answers of MBA assignments/study notes WhatsApp me : +91 99 471 471 85 or purchase it from here)


Stratified Sampling


MBA

Quantitative Analysis for Managerial Applications

ASSIGNMENT


Course Code: MMPC-005

Assignment Code: MMPC-005/TMA/JULY/2022 

Coverage : All Blocks


5. Write short notes on any two of the following:- 

(b) Stratified Sampling

Stratified sampling is a sampling method used in statistics to ensure a representative sample of a population by dividing the population into subgroups, or strata, based on a specific characteristic or variable of interest. The strata are then sampled proportionally to their size in the population, and a sample is taken from each stratum. 

The purpose of stratified sampling is to reduce sampling error and improve the precision of estimates by ensuring that each stratum is represented in the sample. By dividing the population into strata, variations within each stratum can be reduced, and the sampling error can be minimized. Stratified sampling is particularly useful when the variable of interest has high variability within the population, and when the population is heterogeneous.
(For the complete answer and also the full set of answers of MBA assignments/study notes WhatsApp me : +91 99 471 471 85 or purchase it from here)


Mathematical Properties of Arithmetic Mean


MBA

Quantitative Analysis for Managerial Applications

ASSIGNMENT


Course Code: MMPC-005

Assignment Code: MMPC-005/TMA/JULY/2022 

Coverage : All Blocks


5. Write short notes on any two of the following:- 

(a) Mathematical Properties of Arithmetic Mean.

Arithmetic mean, also known as the average, is a widely used measure of central tendency in statistics. It is calculated by adding up all the values in a set of data and dividing by the total number of values. The mathematical properties of arithmetic mean are important to understand in order to interpret and analyze data accurately. 

The first property of arithmetic mean is that it is sensitive to extreme values, also known as outliers. Outliers can significantly affect the arithmetic mean, causing it to be skewed either positively or negatively. Therefore, it is important to identify and handle outliers appropriately when calculating the arithmetic mean.

(For the complete answer and also the full set of answers of MBA assignments/study notes WhatsApp me : +91 99 471 471 85 or purchase it from here)


The means of two large samples of sizes 1000 and 2000 are 67.5 and 68.0 respectively. Test the quality of the means of the two populations each with standard deviation of 2.5. (z table value at α0.05= -1.96).


MBA

Quantitative Analysis for Managerial Applications

ASSIGNMENT


Course Code: MMPC-005

Assignment Code: MMPC-005/TMA/JULY/2022 

Coverage : All Blocks


4. The means of two large samples of sizes 1000 and 2000 are 67.5 and 68.0 respectively. Test the quality of the means of the two populations each with standard deviation of 2.5. (z table value at α0.05= -1.96).

In statistical hypothesis testing, we start by formulating a null hypothesis (H0) and an alternative hypothesis (Ha). The null hypothesis is the statement that we want to test, while the alternative hypothesis is the statement that we want to accept if we reject the null hypothesis. The level of significance (α) is the probability of rejecting the null hypothesis when it is actually true. In this case, the level of significance is α = 0.05.

The null hypothesis in this case is that there is no significant difference between the means of the two populations, or μ1 = μ2. The alternative hypothesis is that there is a significant difference between the means of the two populations, or μ1 ≠ μ2.

(For the complete answer and also the full set of answers of MBA assignments/study notes WhatsApp me : +91 99 471 471 85 or purchase it from here)


What do you understand by Primary Data? What are the various methods of collecting primary data? Also, mention what points to be kept in mind while designing the questionnaire?


MBA

Quantitative Analysis for Managerial Applications

ASSIGNMENT


Course Code: MMPC-005

Assignment Code: MMPC-005/TMA/JULY/2022 

Coverage : All Blocks


3. What do you understand by Primary Data? What are the various methods of collecting primary data? Also, mention what points to be kept in mind while designing the questionnaire?

Primary data refers to data that is collected directly from the source, either through observation or by asking questions. This type of data is original and has not been previously collected, making it particularly valuable for research purposes. Primary data can be collected through various methods, such as surveys, interviews, experiments, and observation. 

Surveys are one of the most common methods of collecting primary data. Surveys can be conducted in various ways, such as through online forms, telephone interviews, face-to-face interviews, or postal mail. Surveys can be structured, where participants are given a set of pre-determined questions, or unstructured, where participants are allowed to respond freely to open-ended questions.

(For the complete answer and also the full set of answers of MBA assignments/study notes WhatsApp me : +91 99 471 471 85 or purchase it from here)


Why is forecasting so important in business? Explain the application of forecasting for long term decisions


MBA

Quantitative Analysis for Managerial Applications

ASSIGNMENT


Course Code: MMPC-005

Assignment Code: MMPC-005/TMA/JULY/2022 

Coverage : All Blocks


2. Why is forecasting so important in business? Explain the application of forecasting for long term decisions.

Forecasting is a critical process in any business. It is the process of predicting future events and trends based on historical data and statistical models. It is used to make decisions about future actions that can have significant impacts on the business. Forecasts are important because they allow businesses to make informed decisions based on what is most likely to happen in the future. There are many reasons why forecasting is important in business. 

First, it helps businesses to plan for the future. Forecasting enables businesses to predict the demand for their products or services and make necessary adjustments to their production schedules or staffing levels. It also helps businesses to plan for future investments, such as capital expenditures or expansion plans. Without accurate forecasts, businesses would be flying blind and making decisions based on incomplete or inaccurate information.

(For the complete answer and also the full set of answers of MBA assignments/study notes WhatsApp me : +91 99 471 471 85 or purchase it from here)


The income of a group of 10,000 persons was found to be normally distributed with mean Rs.750 per month and a standard deviation of Rs. 50, show that of this group about 95% has income exceeding Rs. 668 and only 5% had income exceeding Rs. 832. (area between 750 and 668 = 0.4495, area between 750 and 832 = 0.4495)


MBA

Quantitative Analysis for Managerial Applications

ASSIGNMENT


Course Code: MMPC-005

Assignment Code: MMPC-005/TMA/JULY/2022 

Coverage : All Blocks


1. The income of a group of 10,000 persons was found to be normally distributed with mean Rs.750 per month and a standard deviation of Rs. 50, show that of this group about 95% has income exceeding Rs. 668 and only 5% had income exceeding Rs. 832. (area between 750 and 668 = 0.4495, area between 750 and 832 = 0.4495).

The problem provides us with information about a normally distributed group of 10,000 persons with a mean income of Rs.750 per month and a standard deviation of Rs.50. The goal is to calculate the proportion of the group with income exceeding Rs. 668 and Rs. 832. 

To begin, we can use the formula for the z-score: z = (x - mu) / sigma where x is the income value, mu is the mean income, and sigma is the standard deviation. Using this formula, we can calculate the z-score for an income of Rs.668 as: z = (668 - 750) / 50 = -1.64 Similarly, we can calculate the z-score for an income of Rs.832 as: z = (832 - 750) / 50 = 1.64

(For the complete answer and also the full set of answers of MBA assignments/study notes WhatsApp me : +91 99 471 471 85 or purchase it from here)


Calculate cash from operations


MBA

Accounting for Managers

ASSIGNMENT


Course Code: MMPC-004

Assignment Code: MMPC-004/TMA/JULY/2022 

Coverage : All Blocks


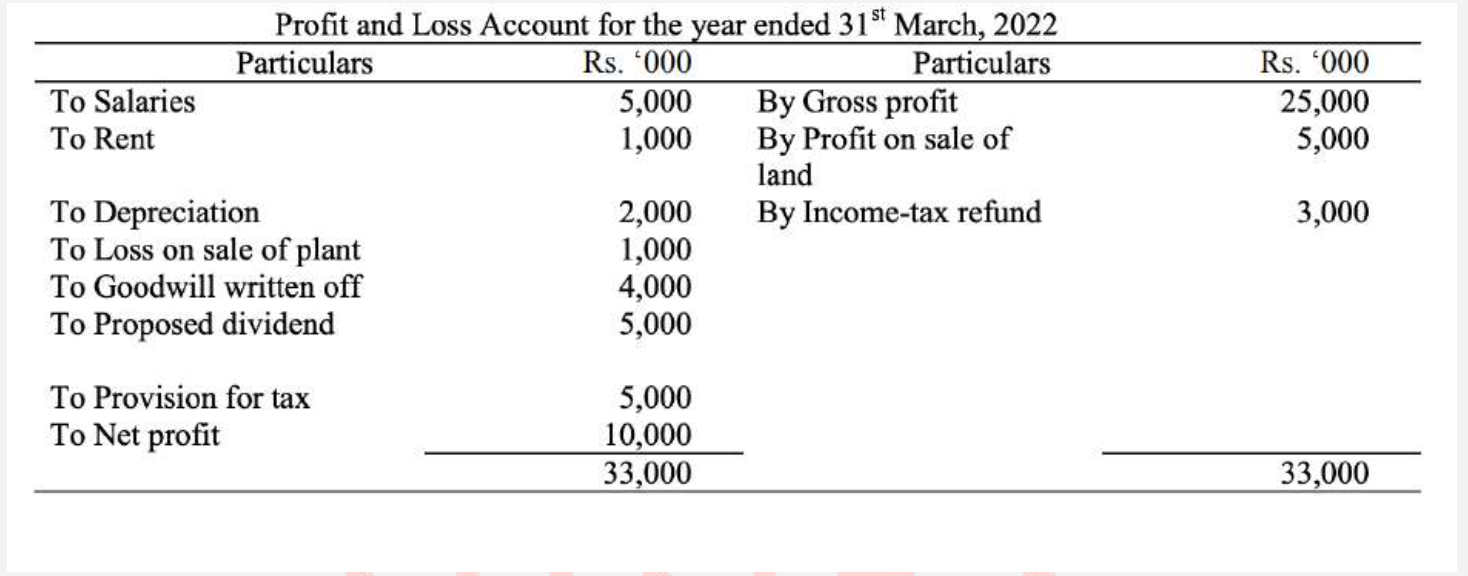
5. From the following calculate cash from operations:


To calculate cash from operations, we need to adjust the net profit for non-cash items and changes in working capital. 

Starting with the net profit of Rs. 10,000, we need to add back the non-cash expenses and losses, which are: Depreciation: Rs. 2,000 Loss on sale of plant: Rs. 1,000 Goodwill written off: Rs. 4,000 So, the total adjustments to net profit are: 2,000 + 1,000 + 4,000 = Rs. 7,000. 

Next, we need to adjust for changes in working capital, which include changes in current assets and liabilities such as accounts receivable, inventory, accounts payable, and accrued expenses

(For the complete answer and also the full set of answers of MBA assignments/study notes WhatsApp me : +91 99 471 471 85 or purchase it from here)


Various contents of an Annual Report


MBA

Accounting for Managers

ASSIGNMENT


Course Code: MMPC-004

Assignment Code: MMPC-004/TMA/JULY/2022 

Coverage : All Blocks


4. Explain in detail the various contents of an Annual Report.

An annual report is a comprehensive document that companies produce once a year to provide shareholders, investors, and other stakeholders with a detailed overview of the company's financial and operational performance. 

The annual report typically contains the following sections: Introduction: This section usually contains a letter from the company's CEO or chairman, in which they discuss the company's achievements over the past year, outline its goals for the future, and thank stakeholders for their support.

(For the complete answer and also the full set of answers of MBA assignments/study notes WhatsApp me : +91 99 471 471 85 or purchase it from here)


What is CVP analysis? Does it differ from break even analysis? How is break-even point calculated?


MBA

Accounting for Managers

ASSIGNMENT


Course Code: MMPC-004

Assignment Code: MMPC-004/TMA/JULY/2022 

Coverage : All Blocks


3. What is CVP analysis? Does it differ from break even analysis? How is break-even point calculated?

CVP analysis is a powerful financial modelling technique that enables managers to understand how changes in sales volume, costs, and selling price impact a company's profitability. The primary focus of CVP analysis is to understand the relationship between sales volume, costs, and profit. By understanding this relationship, managers can make more informed decisions regarding pricing, product mix, and resource allocation. The basic components of CVP analysis are fixed costs, variable costs, selling price, and volume of sales. 

Fixed costs are costs that do not change with changes in sales volume, such as rent, salaries, and insurance. Variable costs, on the other hand, are costs that vary with changes in sales volume, such as raw materials, direct labor, and sales commissions. Selling price is the price at which the product or service is sold, and volume of sales is the number of units sold.

(For the complete answer and also the full set of answers of MBA assignments/study notes WhatsApp me : +91 99 471 471 85 or purchase it from here)


Activity Based Costing


MBA

Accounting for Managers

ASSIGNMENT


Course Code: MMPC-004

Assignment Code: MMPC-004/TMA/JULY/2022 

Coverage : All Blocks


(b) Activity Based Costing

Activity-based costing (ABC) is a cost accounting method that assigns indirect costs to products or services based on the activities required to produce them. This approach recognizes that not all costs are directly related to the volume of output or production, and therefore, a more precise allocation of overhead costs is needed to determine the true cost of a product or service. 

ABC involves identifying the activities that are required to produce a product or service and assigning costs to those activities. The cost of each activity is then allocated to the products or services that consume the activity in proportion to the amount of activity consumed.

(For the complete answer and also the full set of answers of MBA assignments/study notes WhatsApp me : +91 99 471 471 85 or purchase it from here)